Wi-Fi Heatmap Survey: A Practical Guide for IT Pros
- Sosa Solutions NYC
- Aug 9
- 11 min read
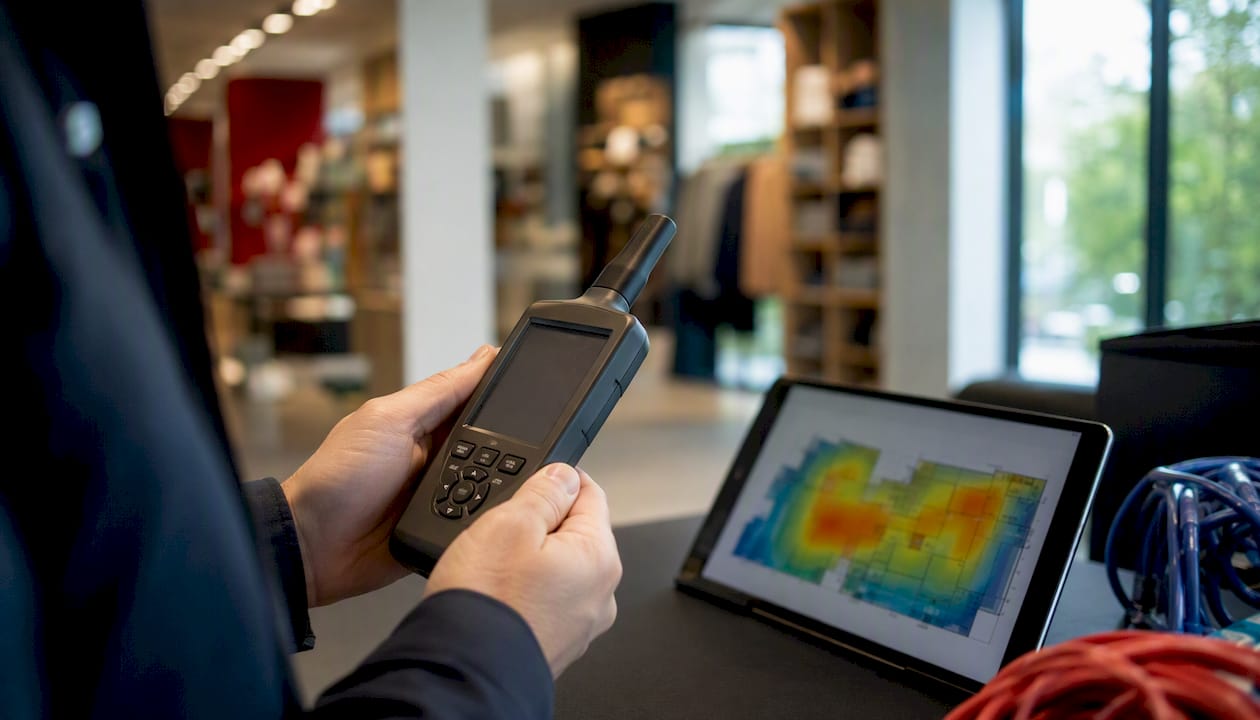
A Wi-Fi heatmap survey overlays wireless performance metrics — RSSI, SNR, noise floor, and throughput — onto a floor plan so you can see exactly where coverage fails, where interference lives, and whether your access points are placed well. If you want immediate progress: grab NetSpot (free tier available), load your floor plan, walk the space clicking measurement points, and you’ll have a working signal map in under an hour. For a retail store opening or a multi-floor environment where POS uptime is non-negotiable, a professionally measured survey using Ekahau-style methodology is the smarter call.
Key Takeaways
A measured Wi-Fi heatmap survey that captures SNR and throughput alongside RSSI, saves a baseline snapshot, and validates fixes with a re-survey gives you the only reliable basis for network remediation decisions.
Point | Details |
Start with SNR, not just RSSI | A strong RSSI with a high noise floor still produces a poor connection; always collect SNR. |
Minimum 15–20 points for small spaces | Higher density (one point per 10–15 feet) is needed for aisle-level retail accuracy. |
Save a baseline snapshot first | Re-survey the same points after every fix and compare snapshots to quantify improvement. |
Use spectrum analysis for interference | Non-Wi-Fi sources (Bluetooth, Zigbee, microwaves) require a spectrum analyzer to diagnose. |
Sosasolutionsnyc for store rollouts | Sosasolutionsnyc provides on-site surveys, remediation plans, and revalidation for NY and FL retail openings. |
Table of Contents
What does a Wi-Fi heatmap survey actually show you?
A wireless site survey produces a color-coded floor plan where each pixel reflects a measured or modeled metric at that location. Green typically means strong signal; red or gray means a dead zone or interference problem. The underlying data can include:
RSSI (Received Signal Strength Indicator): raw signal strength in dBm, the most common heatmap layer
SNR (Signal-to-Noise Ratio): how much stronger the signal is than the background noise — a more reliable predictor of real-world performance than RSSI alone
Noise floor: ambient RF energy at each point, critical for diagnosing interference
Throughput: actual data rate measured at each location, the closest proxy for user experience
Channel utilization / airtime: how busy the RF medium is, which reveals capacity problems invisible to signal-only maps
There are two distinct types of heatmaps worth keeping separate. A signal-design heatmap is built from physical measurements or predictive simulation; it answers “does my network cover this space adequately?” A behavioral analytics heatmap uses existing APs as zone sensors, counting probe requests and association events to show visitor density and dwell time by zone. A small retail store troubleshooting a dead zone at the checkout counter needs the first type. A multi-location retailer trying to understand which store sections get the most foot traffic needs the second. Confusing the two leads to running the wrong survey entirely.
When should you run a wireless network survey?
The most common triggers are a new store opening or remodel, repeated customer or staff complaints about connectivity, throughput degradation during peak hours, and before-and-after validation of a layout change or AP firmware upgrade. Each of those scenarios calls for a slightly different approach.
For a new deployment, run a predictive survey first using a browser-based planner like the noctis-wifi-planner, which performs band-aware ray-cast simulations using per-material attenuation factors. Then validate with a measured survey after hardware is installed. Predictive models are planning aids, not ground truth.
For persistent complaints or throughput degradation, a baseline analytics period of sufficient duration using AP-zone data gives you the behavioral picture before you touch anything. Follow that with a spot measured survey at the problem locations. For seasonal load tests — think a retailer preparing for holiday traffic — run a capacity-focused survey during a representative busy period, not at 9 AM on a Tuesday.
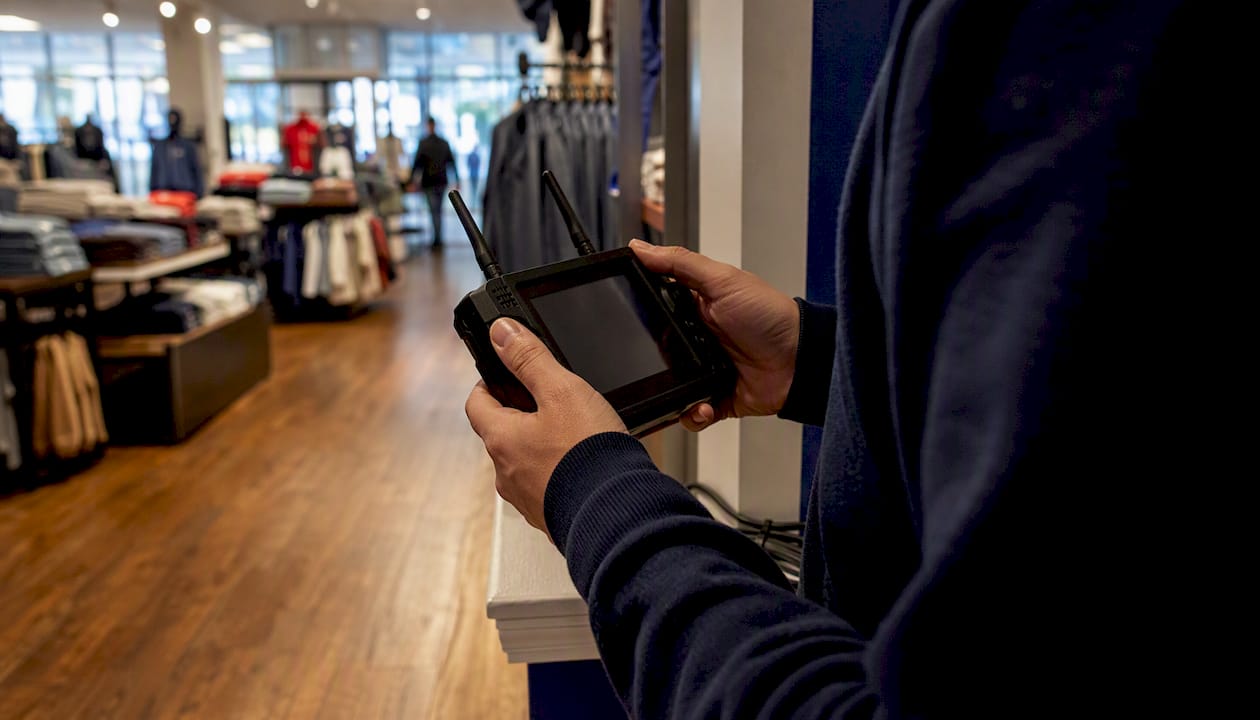
A quick decision framework: ask whether the problem is coverage (weak signal in specific spots), capacity (signal is fine but performance degrades under load), interference (unexplained drops or retries), or behavioral analytics (needing visitor flow data). That answer determines which survey type and which tools to deploy.
Which tools and hardware do you actually need?
The right tool depends on your environment size, accuracy requirements, and budget. Here is how the major categories break down:
Mobile app survey tools (phone or tablet, click-to-measure): best for quick site checks, home networks, and small retail spaces. Modern iOS apps now integrate LiDAR floor scanning so you can build a floor plan and survey simultaneously, then export a PDF report. Fast and low-cost, but accuracy is limited by the phone’s antenna.
Desktop/site-planning tools: tools like Acrylic WiFi Heatmaps support active and passive surveys, generate multiple heatmap types (coverage, throughput, spectrum), and export formal reports — appropriate when multi-parameter analysis or stakeholder reporting is required.
Open-source click-to-measure tools: the ribaldorafael/wifi-heatmap project captures RSSI, SNR, Tx rate, and speed at mapped floor-plan points, supports force-roam for mesh networks, multi-scan averaging, and snapshot comparisons. Practical for DIY home and small-office surveys at zero cost.
Scripted/Python workflows: the jantman/python-wifi-survey-heatmap project documents a repeatable workflow using iperf3 for throughput tests with 10-second per-point measurements, producing high-resolution datasets suitable for before-and-after comparisons.
Spectrum analyzers: required when you suspect non-Wi-Fi interference — Bluetooth, microwave ovens, Zigbee devices, baby monitors. A spectrum analyzer shows RF energy across the full band, not just 802.11 frames. Without one, you can misdiagnose an interference problem as a coverage problem and move APs for no reason.
Dedicated measurement kits (USB dongles, Sidekick-style devices): these use calibrated antennas and controlled radio chains, giving enterprise-grade accuracy that a phone’s built-in Wi-Fi adapter cannot match. Worth the cost for multi-floor stores or environments where the survey report will drive a capital expenditure.
Pro Tip: Disable your VPN before running any throughput or speed test. A VPN adds latency and caps throughput at the tunnel’s overhead, which makes a healthy network look broken in the heatmap data.
How to run a basic measured Wi-Fi heatmap survey
A repeatable survey follows five stages. Skip any of them and you will spend twice as long diagnosing the results.
Prepare. Collect a to-scale floor plan (PDF, PNG, or DXF). Document every AP: model, MAC/BSSID, physical mounting location, and channel/power settings. Label rooms and zones. Write down your goal — coverage validation, capacity check, or interference hunt — because that determines which metrics to prioritize and how dense your measurement grid needs to be.
Configure your tool. Set the floor plan scale (measure a known distance in the image and calibrate). Choose metric modes: RSSI for a quick coverage pass, SNR and throughput for a capacity or quality survey. Enable force-roam for mesh networks — toggle the Wi-Fi adapter off and on at each measurement point so the client reassociates to the nearest node rather than sticking to a distant one. Set sample averaging to at least 3 scans per point for RSSI; use 10-second iperf3 runs for throughput measurements.
Capture data. Walk a systematic grid pattern, clicking measurement points on the floor plan as you go. For small spaces (under 2,000 sq ft), 15–20 points gives a usable map. For analytics-grade surveys or aisle-level retail accuracy, increase density to one point every 10–15 feet. Hold each point for 3–10 seconds for RSSI/SNR; hold 10–60 seconds when capturing throughput or running iperf tests. Avoid measuring in motion — stand still at each point.
Save snapshots. Before changing anything, save a named baseline snapshot. This is the single most important step for reproducibility. After any AP move, power adjustment, or channel change, re-survey the same points and save a second snapshot. The comparison view will show you exactly what changed and by how much.
Post-capture checks. Filter the heatmap by individual AP/BSSID to see each node’s coverage footprint. Check per-room averages against your target thresholds. Export a CSV for raw analysis or a PDF for stakeholder reporting. Flag any zone where RSSI drops below your threshold or SNR falls under 20 dB.
Pro Tip: For a retail store tech audit before a survey, photograph every AP’s physical location and note the ceiling height and mounting angle. That context makes the heatmap far easier to interpret when you’re back at your desk.
What do the metrics mean, and what thresholds matter?
Metric | What it shows | Practical threshold | Action if out of range |
RSSI | Signal strength at the client | Below -75 dBm is marginal | Move or add AP; increase transmit power |
SNR | Signal vs. noise margin | SNR under 20 dB is problematic | Reduce noise sources; move AP closer |
Noise floor | Ambient RF energy | Noise floor values vary; elevated levels warrant investigation | Run spectrum analysis; identify interference source |
MCS index / PHY rate | Modulation and coding scheme in use | Higher MCS = better conditions; MCS 0–2 at distance signals weak link | Improve RSSI or SNR to allow higher MCS |
Throughput | Actual data rate at the point | Depends on application; POS typically needs 5–10 Mbps minimum | Check airtime utilization; add capacity or rebalance SSIDs |
Airtime utilization | How busy the RF medium is | High channel utilization indicates congestion | Add an AP, move to a less-congested channel, or split SSIDs |
Co-channel interference | Same-channel energy from neighboring APs | Visible as elevated noise floor on the active channel | Reassign channels; reduce transmit power on overlapping APs |
SNR is the metric most IT generalists underweight. A location can show -60 dBm RSSI (strong signal) but still perform poorly if the noise floor is -70 dBm, leaving only 10 dB of margin. That scenario is common in dense retail environments with many neighboring networks or Bluetooth-heavy point-of-sale peripherals.
The fix is either a new AP on a different channel or moving clients to 5 GHz or 6 GHz bands where spectrum is less congested. Ekahau’s documentation notes that non-Wi-Fi interference is a frequent root cause that standard signal-only surveys miss entirely — which is exactly why spectrum analysis belongs in any serious troubleshooting workflow.
How to act on your heatmap results
Once you have a map, the diagnosis usually falls into one of five categories. Here is how to triage each one:
Dead zone (RSSI below -75 dBm in a coverage area): move the nearest AP toward the gap, raise transmit power, or add a new AP. Check that the dead zone is not caused by a structural barrier (concrete wall, elevator shaft, metal shelving) before repositioning.
Sticky client / roaming failure: the client is holding onto a distant AP instead of roaming to a closer one. Enable 802.11r fast BSS transition, lower the minimum RSSI threshold on the AP controller, or use band steering. Force-roam during the survey to confirm the problem is real.
Co-channel interference: two APs on the same channel are overlapping. Reassign one to a non-overlapping channel (1, 6, or 11 on 2.4 GHz; any non-overlapping 20 MHz channel on 5 GHz). Reduce transmit power on both to shrink their coverage cells.
Capacity bottleneck: signal is strong but throughput is low under load. Add a second AP on a different channel, migrate high-bandwidth clients to 5 GHz or 6 GHz, or split SSIDs to separate IoT and staff traffic.
Interference from non-Wi-Fi sources: microwave ovens, Zigbee sensors, or Bluetooth devices show up as elevated noise floor on specific channels. A spectrum analyzer identifies the source. Mitigation options include moving to 5 GHz, relocating the interfering device, or shielding.
Prioritize fixes in revenue-impact order: checkout and POS systems first, back-office and inventory second, customer-facing dwell areas third, and low-traffic zones last. A dead zone in the stockroom is annoying; a dead zone at the register during a Saturday rush is a business problem. For guidance on retail IT troubleshooting beyond Wi-Fi, the same triage logic applies across your store’s infrastructure.
Pro Tip: After every fix, re-survey the same measurement points from your baseline snapshot and run a comparison. A 5 dB RSSI improvement sounds modest but can push a location from MCS 3 to MCS 7, doubling effective throughput. Quantify it — that number justifies the next infrastructure budget.
Identify the problem category (coverage, capacity, interference, roaming).
Apply the targeted fix from the list above.
Re-survey the same points.
Compare snapshots and document the delta.
Escalate to a professional if the problem persists after two fix cycles.
How do you make a survey reproducible and report-ready?
A survey no one can reproduce is a survey no one can trust. Before you close the tool, run through this checklist:
Floor plan is to scale and the calibration distance is documented
Every AP is labeled with its BSSID and physical location on the map
Measurement points are saved (not just the heatmap image) so they can be re-walked
Date, time, and load conditions are noted (was the store open? How many clients were connected?)
Tool settings (metric mode, averaging, force-roam on/off) are recorded
Baseline snapshot is saved before any changes are made
For reporting, PDF exports work for executive summaries and vendor conversations. CSV exports give you raw per-point data for trend analysis or import into a spreadsheet. If your tool supports it, KMZ export allows overlaying survey data on a building map in Google Earth or similar platforms, which is useful for multi-building campuses.
A before-and-after snapshot comparison is the single most persuasive document you can bring to a budget conversation. It shows the problem in the original heatmap, the fix applied, and the measured improvement in the second heatmap — no interpretation required.
Acrylic WiFi Heatmaps supports multi-parameter export across coverage, throughput, and spectrum layers, which is worth the added complexity when you need to present findings to stakeholders who will approve remediation spending.
When should you DIY, and when should you hire a professional?
For a single small store, a quick dead-zone check, or simple mesh troubleshooting, a DIY survey with NetSpot or an open-source tool is entirely appropriate. You can get a usable coverage map in an afternoon with no specialized hardware.
Hire a professional when the stakes or complexity exceed what a phone-based survey can reliably capture:
Multi-floor or multi-store rollout where consistent methodology across sites matters
Complex RF environments (dense concrete, metal shelving, elevator banks, neighboring tenants on shared channels)
POS or payment systems with uptime SLAs — a misconfigured network at a register is a compliance and revenue risk
Interference suspected from non-Wi-Fi sources requiring spectrum analysis hardware
Pre-opening validation for a new retail location where the cost of a failed launch exceeds the cost of a professional survey
Ongoing monitoring requirements where you need documented baselines and periodic re-surveys
For retail store openings in New York and Florida, Sosasolutionsnyc handles the full cycle: discovery, baseline measured survey, remediation plan, verification survey, and optional ongoing monitoring. Professional surveys reduce network design errors compared to non-validated deployments by capturing real-world RF behavior that predictive models cannot fully anticipate. That gap matters most in retail environments where shelf layouts, refrigeration units, and seasonal fixture changes alter RF propagation between the design phase and opening day. For context on how Wi-Fi surveys fit into retail store connectivity planning more broadly, the infrastructure picture extends well beyond signal mapping alone.
An honest take on what most Wi-Fi surveys get wrong
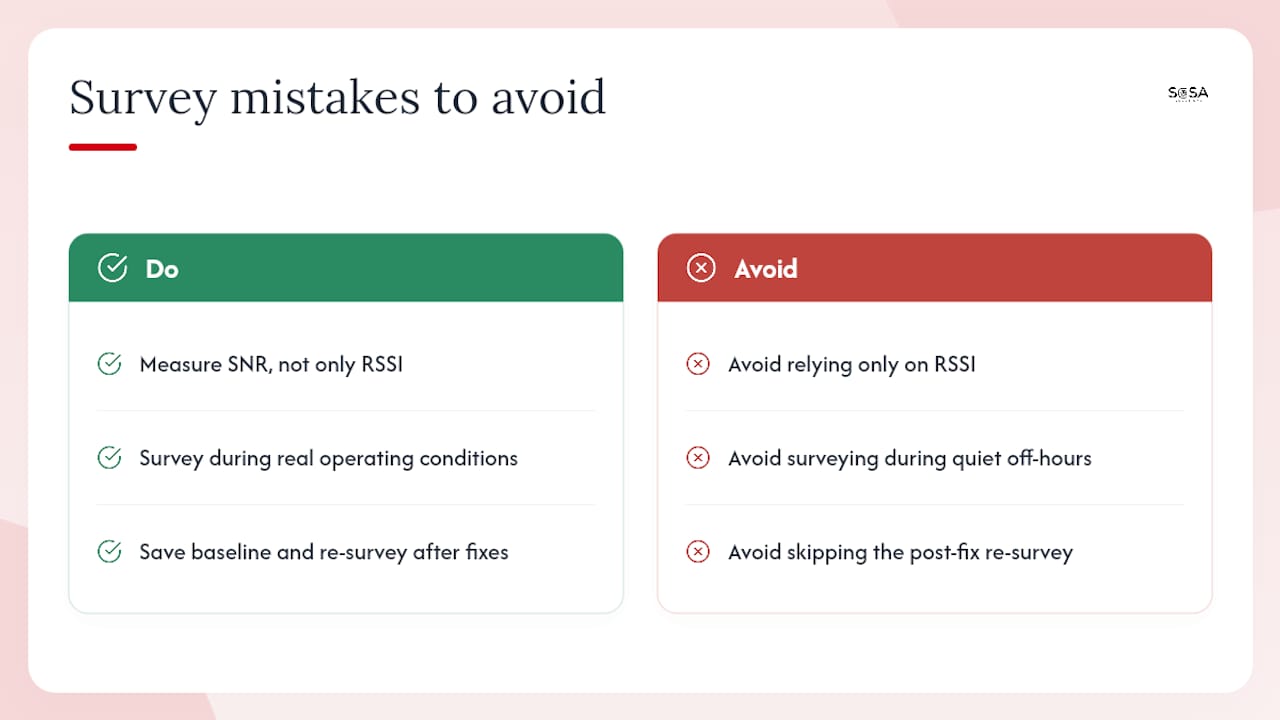
Most DIY surveys stop at RSSI. You get a pretty color map, see a red zone near the back wall, move an AP, and call it done. The problem is that RSSI alone tells you almost nothing about what a client actually experiences. A location with -62 dBm signal and a -72 dBm noise floor has only 10 dB of SNR margin — that is a struggling connection, not a healthy one, and the heatmap will show it as green.
The second mistake is surveying under the wrong conditions. Measuring at 7 AM before staff arrives gives you a clean, quiet RF environment that bears no resemblance to a busy Saturday afternoon when 40 clients, a dozen IoT sensors, and three competing SSIDs are all contending for airtime. A survey that does not reflect real operating conditions is a survey that will not predict real problems.
The third, and most consequential, mistake is skipping the re-survey after fixes. Without a saved baseline and a comparison snapshot, you cannot prove the fix worked, cannot quantify the improvement, and cannot defend the decision to spend money on additional hardware. The snapshot is not a nice-to-have. It is the entire evidentiary basis for every infrastructure decision that follows.
Sosasolutionsnyc handles your store’s Wi-Fi survey end to end
Running a measured survey, interpreting the results, and executing a remediation plan takes time and the right hardware. For retail operators in New York and Florida preparing for a store opening or dealing with persistent network issues, Sosasolutionsnyc delivers on-site measured surveys, a written remediation plan with prioritized fixes, a revalidation survey after changes, and SLA-focused monitoring for ongoing visibility.
The difference from a DIY approach is accountability: every survey produces a documented baseline, a before-and-after comparison, and a clear record of what was fixed and why. For store openings where POS uptime is non-negotiable, that documentation matters as much as the signal map itself. Contact Sosasolutionsnyc through the Store Opening IT Solutions page to scope a survey for your location.
Sources
Recommended
Comments